I’ve been playing around with the data science projects from codeacademy for a few weeks. First I played with stocks data here and here.
Today, I’ll be working through the second [codeacademy data science independant project: Watching the Stock Market]
This is a continuation of my work on the codeacademy data science independant project #2: Explore a Sample Database.
The database for this project is related to a fictional music store. As you can see in the diagram of the image below, it’s a little more complicated than the single table stocks database!
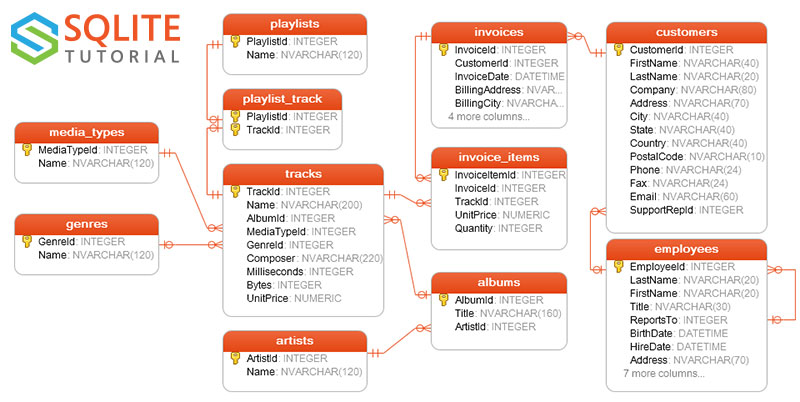
database diagram
Like the last project, this one is broken up into a sets of challenges. In an upcoming post, I’ll examine the intermediate and advanced challenges
library(DBI)
db = dbConnect(RSQLite::SQLite(), dbname = "../../data/Music Store - Chinook/chinook.db")
Basic Challenges
1. Which tracks appeared in the most playlists? How many playlist did they appear in?
   SELECT track_list.TrackId,
          name,
          -- compute how many playlists each track is in
          COUNT(track_list.TrackId) AS playlist_count
     FROM playlist_track AS track_list
LEFT JOIN tracks
       ON track_list.TrackId = tracks.TrackId
       GROUP BY track_list.TrackId
   -- compare the count of each track to the max count
   HAVING COUNT(track_list.TrackId) =
          -- compute the max count here
          (SELECT MAX(plist_counts.playlist_count)
            FROM (SELECT TrackId, COUNT(*) AS playlist_count
                    FROM playlist_track
GROUP BY TrackId) AS plist_counts)| TrackId | Name | playlist_count |
|---|---|---|
| 3403 | Intoitus: Adorate Deum | 5 |
| 3404 | Miserere mei, Deus | 5 |
| 3408 | Aria Mit 30 Veränderungen, BWV 988 “Goldberg Variations”: Aria | 5 |
| 3409 | Suite for Solo Cello No. 1 in G Major, BWV 1007: I. Prélude | 5 |
| 3410 | The Messiah: Behold, I Tell You a Mystery… The Trumpet Shall Sound | 5 |
| 3411 | Solomon HWV 67: The Arrival of the Queen of Sheba | 5 |
| 3415 | Symphony No.5 in C Minor: I. Allegro con brio | 5 |
| 3416 | Ave Maria | 5 |
| 3417 | Nabucco: Chorus, “Va, Pensiero, Sull’ali Dorate” | 5 |
| 3418 | Die Walküre: The Ride of the Valkyries | 5 |
Putting this together required using two tables - playlist_track, which connects TrackId to PlaylistId and the tracks table, which has information about each song. The playlist_track table has a row for each track - playlist combination. By counting how many times a track shows up in this table, we get a count of how many playlists that track is in. Then if you filter the playlist_track table so that it only shows the tracks that show up the max number of times, you see the tracks that are in the most playlists. The last bit that needs to be done after that is to bring in the track name, as I did with the LEFT JOIN.
2. Which track generated the most revenue? which album? which genre?
   SELECT invoice_items.TrackId, Name, SUM(invoice_items.UnitPrice * Quantity) AS track_revenue
     FROM invoice_items
LEFT JOIN tracks
       ON invoice_items.TrackId = tracks.TrackId
 GROUP BY invoice_items.TrackId
ORDER BY track_revenue DESC;| TrackId | Name | track_revenue |
|---|---|---|
| 2832 | The Woman King | 3.98 |
| 2850 | The Fix | 3.98 |
| 2868 | Walkabout | 3.98 |
| 3177 | Hot Girl | 3.98 |
| 3200 | Gay Witch Hunt | 3.98 |
| 3214 | Phyllis’s Wedding | 3.98 |
| 3223 | How to Stop an Exploding Man | 3.98 |
| 3250 | Pilot | 3.98 |
| 2820 | Occupation / Precipice | 1.99 |
| 2821 | Exodus, Pt. 1 | 1.99 |
So we can see that the top 8 tracks above garnered the most revenue. I didn’t look these up, but I don’t recognize any of them ¯\(ツ)/¯.
What about Albums? Which ALbum garnered the most revenue?
   SELECT tracks.AlbumID, Title, SUM(invoice_items.UnitPrice * Quantity) AS album_revenue
     FROM invoice_items
LEFT JOIN tracks
       ON invoice_items.TrackId = tracks.TrackId
LEFT JOIN albums
       ON tracks.AlbumID = albums.AlbumID
 GROUP BY tracks.AlbumID
ORDER BY album_revenue DESC;| AlbumId | Title | album_revenue |
|---|---|---|
| 253 | Battlestar Galactica (Classic), Season 1 | 35.82 |
| 251 | The Office, Season 3 | 31.84 |
| 23 | Minha Historia | 26.73 |
| 228 | Heroes, Season 1 | 25.87 |
| 231 | Lost, Season 2 | 25.87 |
| 141 | Greatest Hits | 25.74 |
| 73 | Unplugged | 24.75 |
| 227 | Battlestar Galactica, Season 3 | 23.88 |
| 229 | Lost, Season 3 | 21.89 |
| 224 | Acústico | 21.78 |
The most revenue generating album? Looks like it isn’t even an album and more the first season of Battlestar Galactica!
Now what about Genre?
   SELECT tracks.GenreId,
          genres.Name,
          SUM(invoice_items.UnitPrice * Quantity) AS genre_revenue
     FROM invoice_items
LEFT JOIN tracks
       ON invoice_items.TrackId = tracks.TrackId
LEFT JOIN genres
       ON tracks.GenreId = genres.GenreId
 GROUP BY tracks.GenreId
ORDER BY genre_revenue DESC;| GenreId | Name | genre_revenue |
|---|---|---|
| 1 | Rock | 826.65 |
| 7 | Latin | 382.14 |
| 3 | Metal | 261.36 |
| 4 | Alternative & Punk | 241.56 |
| 19 | TV Shows | 93.53 |
| 2 | Jazz | 79.20 |
| 6 | Blues | 60.39 |
| 21 | Drama | 57.71 |
| 14 | R&B/Soul | 40.59 |
| 24 | Classical | 40.59 |
The most revenue generating? Rock!
3. Which countries have the highest sales revenue? What percent of total revenue does each country make up?
In the last challenge, we examined how we can figure out which items in the database produce the most revenue and further which groups of items produce the most revenue. The conclusion from all of that being is that investing in more of those classes of items can produce more revenue.
In this challenge we will use metadata about customers to examine where in the world (literally) the revenue comes from. As the challenge asks, what countries produce the most revenue? Importantly, we can get country daya from two different sources: customer country and billing country. I’m more curious about customer country, so we’ll go there.
   SELECT country,
          SUM(invoice_items.UnitPrice * Quantity) AS country_revenue,
          ROUND(SUM(invoice_items.UnitPrice * Quantity) /
                (SELECT SUM(invoice_items.UnitPrice * Quantity)
                   FROM invoice_items) * 100,
                2) AS percent_total_revenue
     FROM invoice_items
LEFT JOIN invoices
       ON invoice_items.InvoiceId = invoices.InvoiceId
LEFT JOIN customers
       ON invoices.CustomerId = customers.CustomerId
 GROUP BY country
ORDER BY country_revenue DESC;| Country | country_revenue | percent_total_revenue |
|---|---|---|
| USA | 523.06 | 22.46 |
| Canada | 303.96 | 13.05 |
| France | 195.10 | 8.38 |
| Brazil | 190.10 | 8.16 |
| Germany | 156.48 | 6.72 |
| United Kingdom | 112.86 | 4.85 |
| Czech Republic | 90.24 | 3.88 |
| Portugal | 77.24 | 3.32 |
| India | 75.26 | 3.23 |
| Chile | 46.62 | 2.00 |
Well, there you have it! The US generated the most revenue out of all the countries - $523.06, which is 22.46% of total revenue.
4. How many customers did each employee support, what is the average revenue for each sale, and what is their total sale?
With this question, we are trying to get at how personnel impact revenue.
How do employees interact with customers? How many customers is each employee helping?
   SELECT employees.FirstName,
          employees.LastName,
          COUNT(*) AS customers_helped
     FROM customers
LEFT JOIN employees
       ON customers.SupportRepId = employees.EmployeeId
GROUP BY SupportRepId| FirstName | LastName | customers_helped |
|---|---|---|
| Jane | Peacock | 21 |
| Margaret | Park | 20 |
| Steve | Johnson | 18 |
Well, looks like they all help customers just about the same amount.
Okay, so now we know how customers are helped by the sales team, but how much do customers spend on average?
   SELECT AVG(Total) AS average_sale
FROM invoices| average_sale |
|---|
| 5.65194174757282 |
So now that we know how many customers each sales rep helps and the average amount of money a customer spends in a single session, how much revenue is each employee responsible for?
   SELECT employees.FirstName,
          employees.LastName,
          SUM(invoices.Total) AS total_revenue
     FROM invoices
LEFT JOIN customers
       ON invoices.CustomerId = customers.CustomerId
LEFT JOIN employees
       ON customers.SupportRepId = employees.EmployeeId
GROUP BY customers.SupportRepId| FirstName | LastName | total_revenue |
|---|---|---|
| Jane | Peacock | 833.04 |
| Margaret | Park | 775.40 |
| Steve | Johnson | 720.16 |
Well this just goes to show that interacting with more customers is at least related to total revenue generated by an employee. That said, with an N of 3, you can’t really learn much.