This is a continuation of my work on the codeacademy data science independant project #1: Watching the Stock Market. My first post is here.
In this project, the basic tasks are:
- What are the distinct stocks in the table?
- Query all data for a single stock. Do you notice any overall trends?
- Which rows have a price above 100? between 40 to 50, etc?
- Sort the table by price. What are the minimum and maximum prices?
Setup
I write this blog using rmarkdown and the entire project is powered by bookdown. SO there’s some setup that needs to take place to get it all to work.
library(DBI)
db = dbConnect(RSQLite::SQLite(), dbname = "../../data/stocks/stocks.db")
What are the distinct stocks in the table?
SELECT DISTINCT name
FROM stocks;| name |
|---|
| Apple |
| Boeing |
| Electronic Arts |
| Spotify |
| NVIDIA |
In my last post about putting together the database, I said that I was collecting data on stocks for Apple, Boeing, Spotify, EA, and Nvidia. Here’s the proof!
Query all data for a single stock. Do you notice any overall trends?
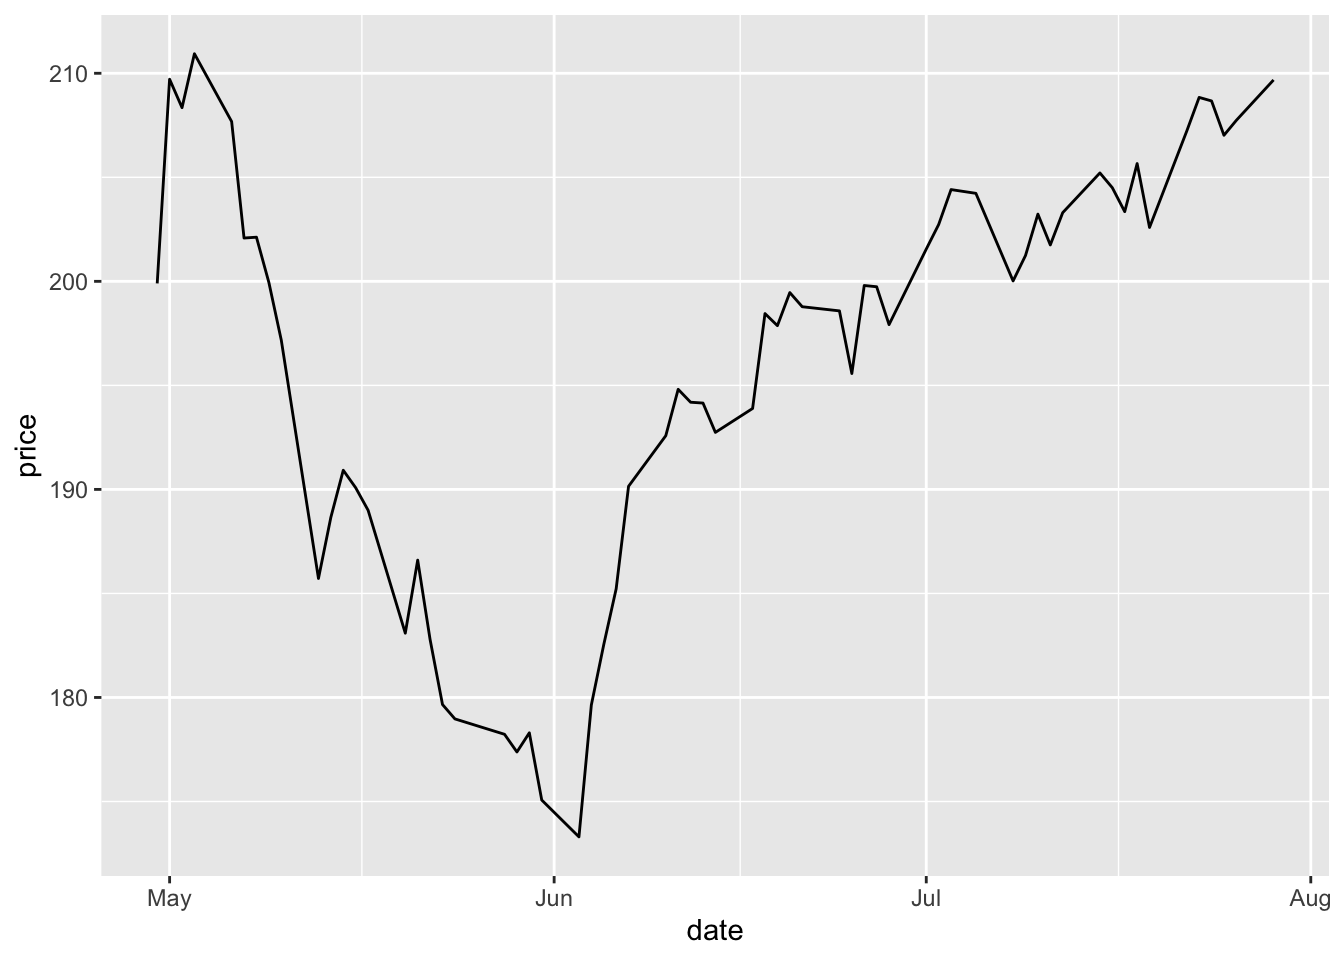
Alright! To analyze trends for the Apple stocks, we’ll plot them thorugh time. And, we’ll do it in R! First, I’ll run some SQL code to extract the APPL stocks. Silently, the output of the SQL query below will be returned as variable we can access in an R code chunk, appl_stocks.
SELECT *
FROM stocks
WHERE name = 'Apple'
library(ggplot2)
appl_stocks$date <- as.Date(appl_stocks$date, "%m/%d/%y")
ggplot(appl_stocks, aes(x = date, y = price)) +
geom_line()
Huh! Something happened in the beginning of June that was bad for Apple’s stock. Looks like it is taking about two months for the price to recover. Wonder what that is… My first guess was the anouncement of Johnny Ive, but I looked and that wasn’t until the end of June. My best guess is decline in iPhone sales coupled with some negative predictions of tech stocks.
Which rows have a price above 100? between 40 to 50, etc?
This just requires some simple filtering!
SELECT COUNT(*)
FROM stocks
WHERE price > 100;| COUNT(*) |
|---|
| 255 |
Wow! That’s a few stocks!
SELECT COUNT(*)
FROM stocks
WHERE price >= 40
AND price <= 50;| COUNT(*) |
|---|
| 0 |
Well, I picked pricy stocks…
Sort the table by price. What are the minimum and maximum prices?
These are the least expensive stocks
SELECT *
FROM stocks
ORDER BY price;| symbol | name | date | price |
|---|---|---|---|
| EA | Electronic Arts | 7/19/19 | 87.50 |
| EA | Electronic Arts | 7/22/19 | 88.14 |
| EA | Electronic Arts | 7/23/19 | 88.22 |
| EA | Electronic Arts | 7/29/19 | 88.87 |
| EA | Electronic Arts | 7/25/19 | 89.16 |
| EA | Electronic Arts | 7/18/19 | 89.19 |
| EA | Electronic Arts | 7/26/19 | 89.51 |
| EA | Electronic Arts | 7/16/19 | 89.55 |
| EA | Electronic Arts | 7/17/19 | 89.70 |
| EA | Electronic Arts | 7/24/19 | 89.78 |
And these are the most expensive stocks.
SELECT *
FROM stocks
ORDER BY price DESC;| symbol | name | date | price |
|---|---|---|---|
| BA | Boeing | 7/19/19 | 377.3600 |
| BA | Boeing | 4/30/19 | 375.5325 |
| BA | Boeing | 6/26/19 | 374.9400 |
| BA | Boeing | 6/20/19 | 374.8800 |
| BA | Boeing | 5/1/19 | 374.6476 |
| BA | Boeing | 5/3/19 | 374.3095 |
| BA | Boeing | 6/24/19 | 373.9900 |
| BA | Boeing | 6/18/19 | 373.9600 |
| BA | Boeing | 5/2/19 | 373.6533 |
| BA | Boeing | 7/22/19 | 373.4200 |