I’ve started exploring the crash data of Pennsylvania car crashes. I’ve documented my first discovery with these data here (although that post can also just be classified under me complaining about PDFs).
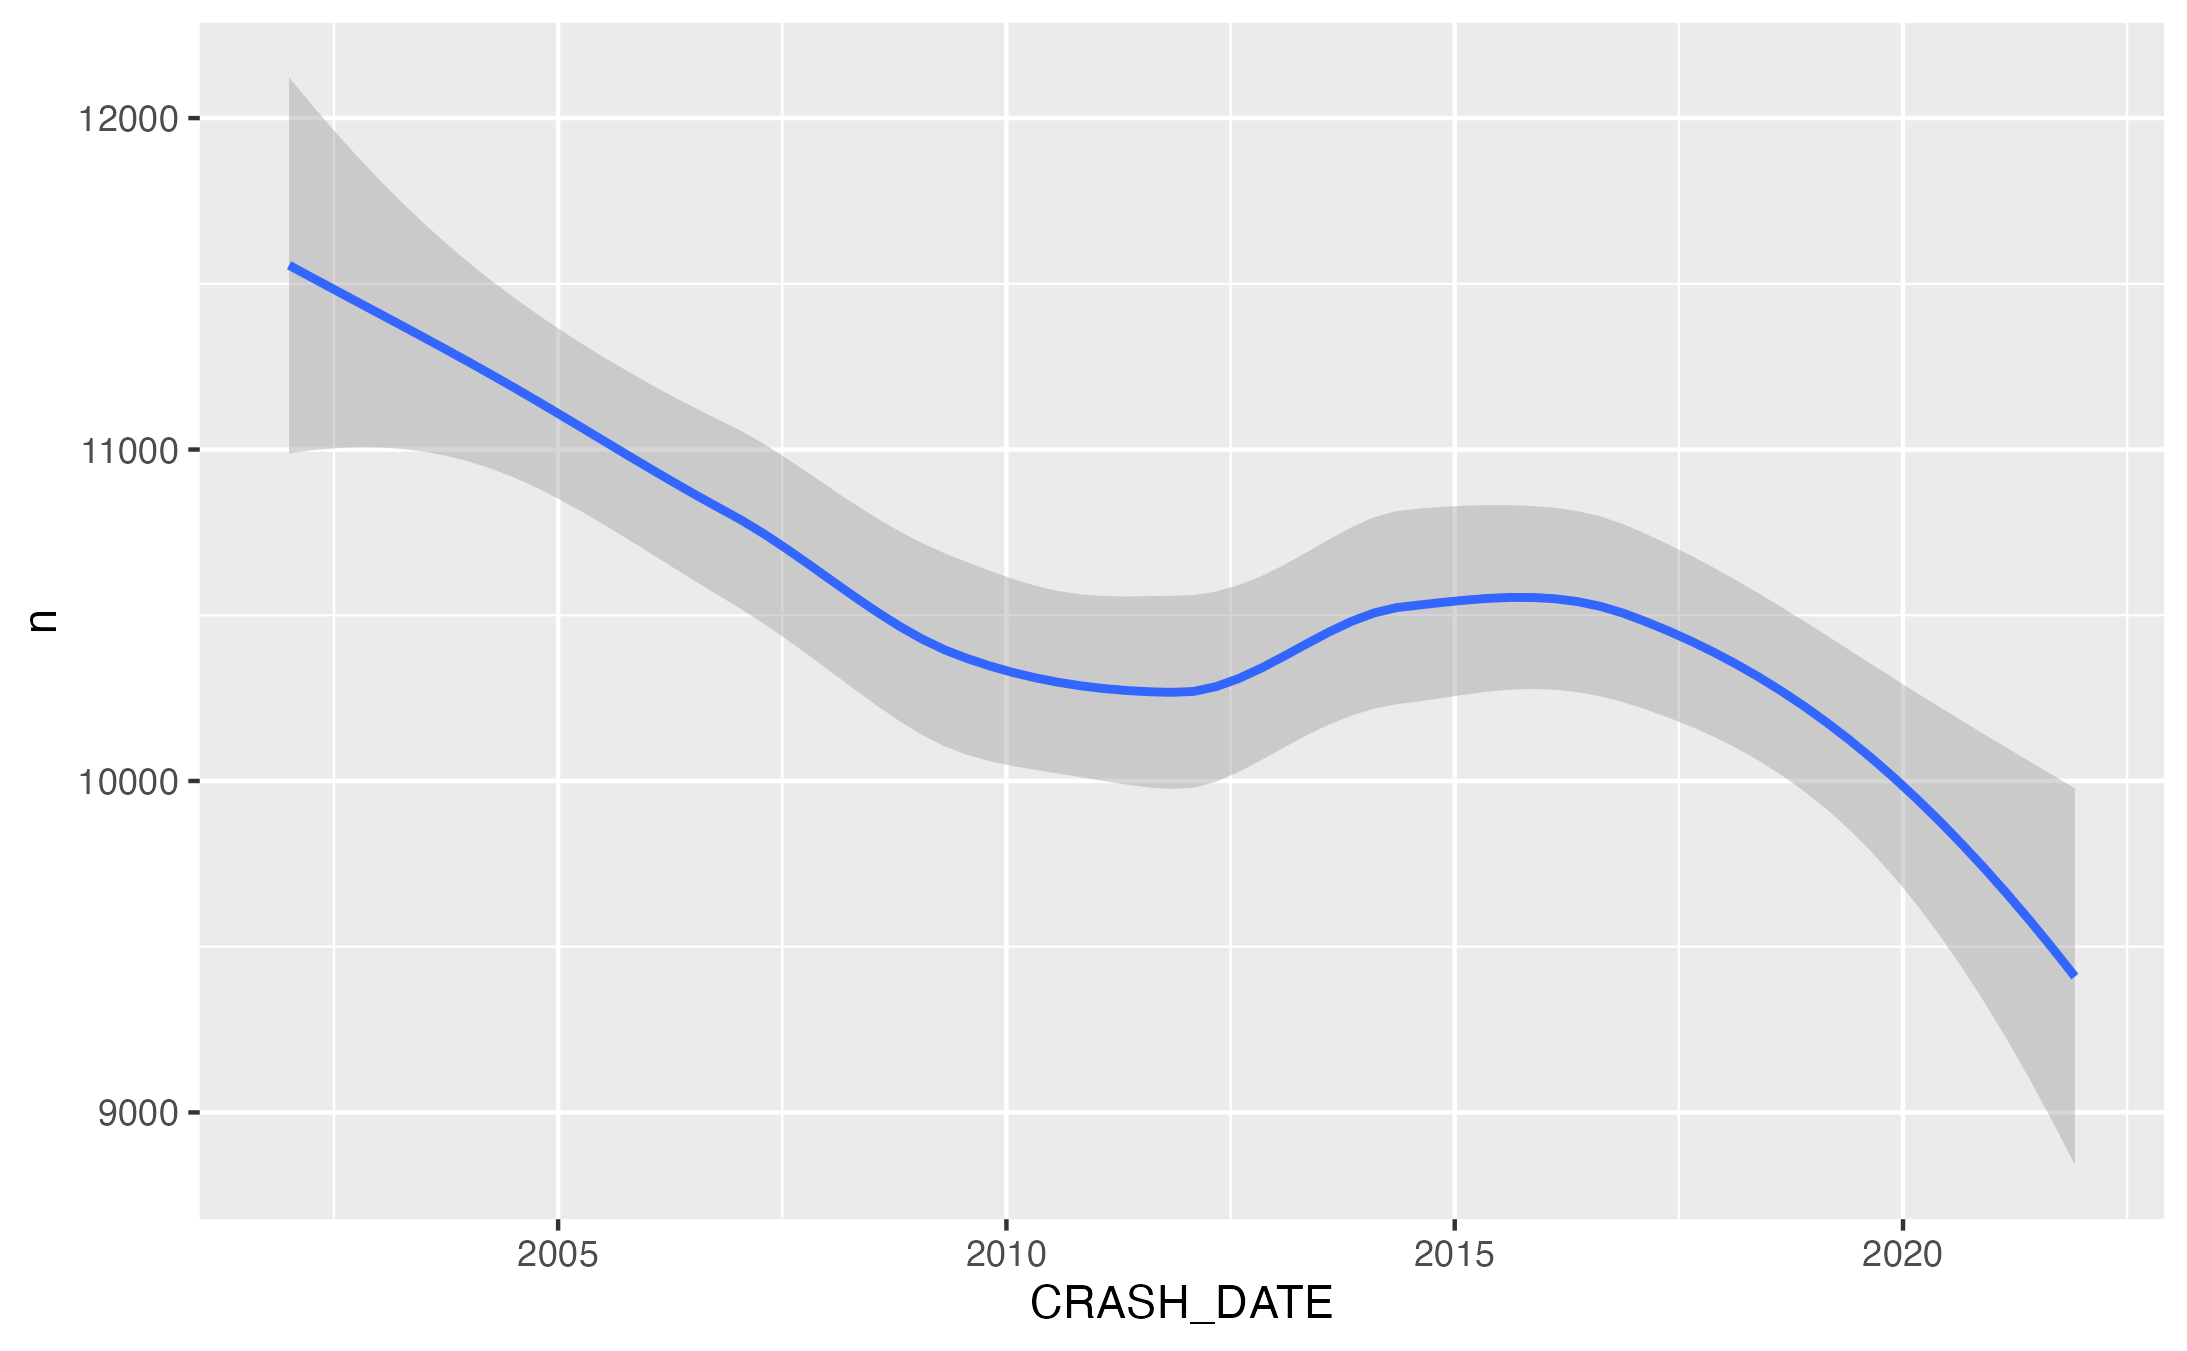
My first discovery was something odd about the number of crashes. In the data set, crashes are recorded on the month and year that they occur (presumably, recording the day of crash could make identifying the individuals involved easy). I counted the number of crashes per month and visualized them with a regression line, just to see trends and what I saw surprised me:

Have there been less crashes over time?
This is weird and unexpected. Why would crashes become less frequent?
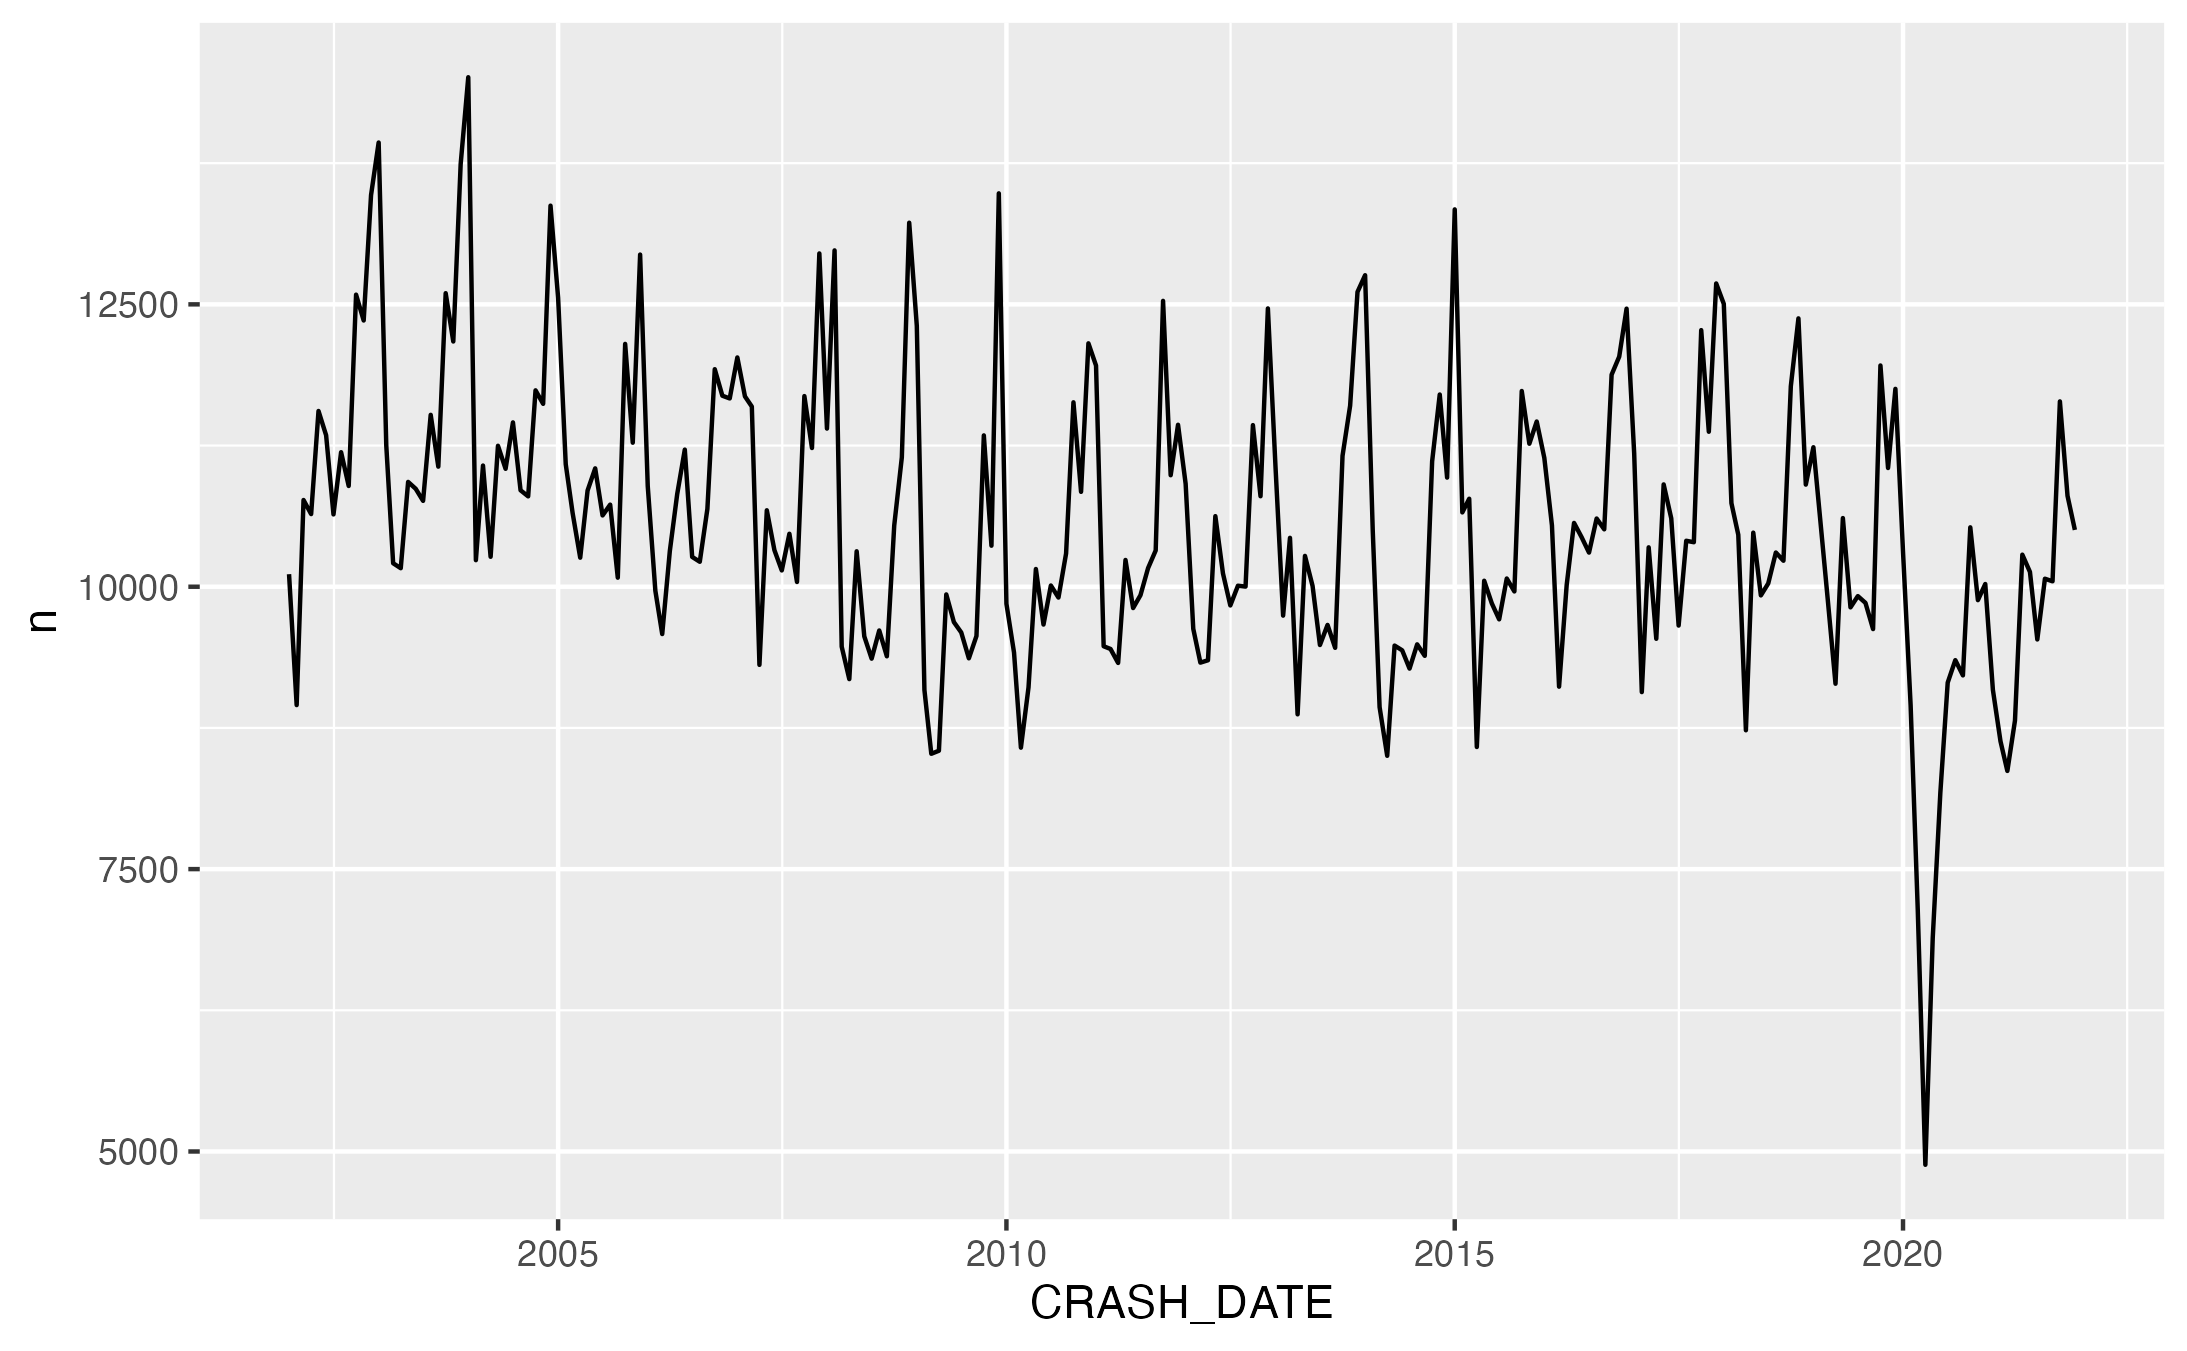
I decided to plot the data again, but time, the raw data:

PHEW! Okay, that’s more in line with what I was expecting. The lack of drivers and subsequent crashes in March 2020 drastically altered the regression.
Some other notes on the crash data (none of these seem to be particularly surprising or unknown. I just think it’s fun to hear about things and then be able to replicate those findings):
- crashes seem to follow a cyclical pattern throughout the year. When do crashes get worse though? Around the holidays perhaps?
- there were SO FEW crashes in the pandemic times. It’s interesting to see how crashes rebounded after initial lockdown and it seems like the peak crashes in 2020 are more muted than in other years. I wonder if that’s true? I also wonder if makeup of car crashes is different? does lockdown have a higher proportion of pedestrians involved? What about freight vs non-freight traffic? Are people getting into fewer crashes in cities as folks work fro the office less?
What I’ve learned
- Don’t initially visualize with regression line. visualize the raw data.
- the exploratory phase of analysis generates SO MANY questions. I will have to find a way to keep them all straight and then find a way to decide which ones I want to answer.
- I’m really going to have to be careful about how I handle crash data from 2020.
That’s all for now! The notebook I used to make the figures in this post is here